Interest in Kubernetes has grown steadily over the past few years, and many enterprises are adopting it along with microservices architectures in their production environments. Adopting distributed services introduces new challenges, however. Understanding and debugging what is happening in a microservices‑based application can be difficult, especially if there are a large number of services. To spot failures or performance problems, you need a distributed tracing tool which tracks requests end-to-end as data is passed among the microservices that make up an application.
OpenTracing is a specification and set of APIs for distributed tracing. In a previous post we showed how to enable distributed tracing for applications proxied and load balanced by NGINX Open Source and NGINX Plus, using the open source module (nginx-opentracing) created by the OpenTracing community. At the time of writing, Open Tracing provides libraries for nine programming languages.
Now, we are also adding native support for OpenTracing of HTTP and gRPC requests in a Kubernetes cluster when using the NGINX and NGINX Plus Ingress Controllers for Kubernetes to load balance the traffic in the cluster.
There are a variety of use cases for using OpenTracing, and here we’re focusing on tracing server endpoints with request context propagation. In a distributed environment, each application inside the cluster is seen as a different server. Imagine two apps or services that are both involved in processing a request from a client. For example, in the topology shown in the following diagram App1 is a web server that handles an HTTP request and redirects it to App2. Both applications are running inside a Kubernetes cluster load balanced by the NGINX Ingress Controller and OpenTracing is enabled, so we can trace the request from the Ingress Controller as it passes through App1 and reaches App2.
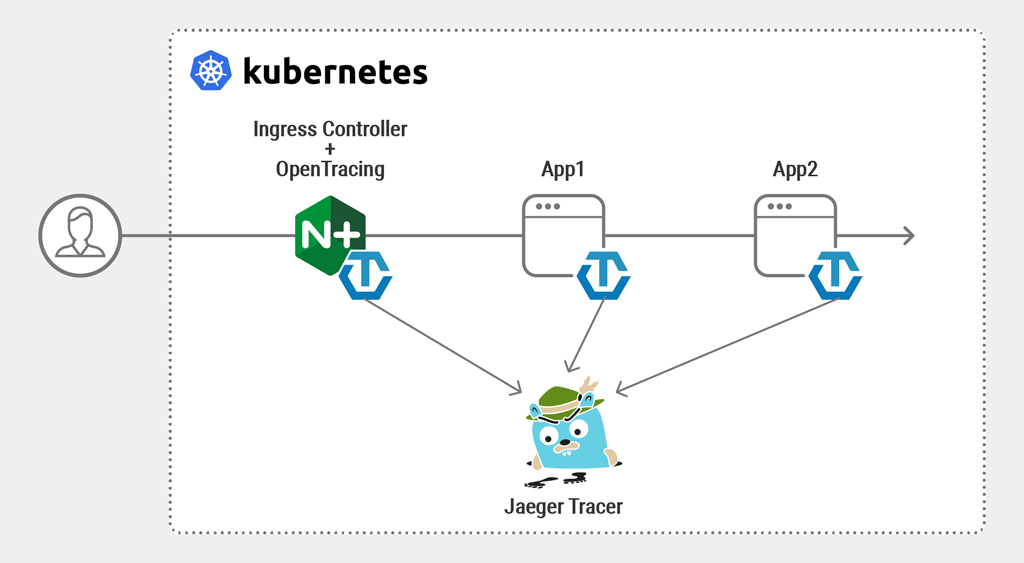
Information about each operation performed by a component in the system (such as a service) is captured in what OpenTracing calls a span, and chaining the spans together enables us to identify and track a request during its journey through the microservices in the cluster.
Note: At the time of writing, OpenTracing is available only in the edge version of the NGINX Ingress Controller.
Building OpenTracing into the NGINX Ingress Controller Image
To use OpenTracing with our Ingress Controller, you need to incorporate the OpenTracing module into the Docker image for the NGINX or NGINX Plus Ingress Controller, and designate the tracer you’re using.
In the GitHub repository for the Ingress Controller, we provide separate Dockerfiles for NGINX and NGINX Plus. They both incorporate the open source OpenTracing module it into the Docker image, but in different ways:
- For NGINX, DockerfileWithOpentracing downloads the OpenTracing module from GitHub and compiles it in manually during the first stage of the Docker build.
- For NGINX Plus, DockerfileWithOpentracingForPlus uses the package manager to retrieve the dynamic module that NGINX builds from the open source OpenTracing module and maintains.
Perform these steps:
- (Optional.) Designate a tracer other than the default, Jaeger. Plug‑ins are also available for Datadog, LightStep, and Zipkin. To use a different tracer, modify the Dockerfile as specified in the Prerequisites section of our instructions for enabling OpenTracing.
-
Build the Docker image using the instructions in the Ingress Controller repo. In Step 3, specify the appropriate Dockerfile.
For NGINX:
$ make clean
$ make DOCKERFILE=DockerfileWithOpentracing PREFIX=YOUR-PRIVATE-REGISTRY/nginx-ingress
For NGINX Plus:
$ make clean $ make DOCKERFILE=DockerfileWithOpentracingForPlus PREFIX=YOUR-PRIVATE-REGISTRY/nginx-plus-ingress -
Install the image using the instructions in the Ingress Controller repo.
Before running the
kubectlapplycommand in Section 3 of the instructions, remember to update the YAML file to specify the newly built image that has OpenTracing incorporated:containers: - image: IMAGE_WITH_OPENTRACING - The
opentracingkey enables OpenTracing for all Ingress resources created in the cluster. - The
opentracing-tracerkey specifies the path to the tracer library, which gets downloaded and copied into the Ingress Controller image when you build it. - The
opentracing-tracer-configkey embeds the tracer configuration. Theservice_namefield defines the service associated with the actual span, and thereporterfield specifies the address and port of the tracer (in our case, the address and port of the Jaeger service deployed by the all-in-one template in the previous section). Thesamplerfield specifies the client sampling configuration; for simplicity, we’re configuring the “Constant” sampler (const), which samples all traces. IC_HTTP_PORTis the HTTP port in the Ingress Controller pod (80 by default)IC_IP_ADDRESSis the IP address of the Ingress Controller pod. If you are using minikube, this is the minikube IP address.
Deploying the Jaeger Tracer
For this blog we’re using the default tracer, Jaeger, and deploying it inside the cluster for simplicity, but it can be also deployed externally. The Ingress Controller pod and the application pods that use OpenTracing must have access to the tracer.
Also for simplicity, we’re using the all-in-one template provided by Jaeger to set up a non‑production Jaeger instance in the cluster. The resulting deployment – suitable for a development environment – creates a Jaeger pod and the set of services needed to access the pod; it sets up the latest Jaeger version in the default namespace, with in‑memory storage and limited functionality.
$ kubectl create -f https://raw.githubusercontent.com/jaegertracing/jaeger-kubernetes/master/all-in-one/jaeger-all-in-one-template.ymlIn production, we recommend using the Jaeger Operator for installation. For more information about Jaeger, see the Jaeger website.
Enabling OpenTracing
The following ConfigMap (nginx-config.yaml) for the NGINX Ingress Controller enables OpenTracing globally. It adds three new ConfigMap keys in the data section:
kind: ConfigMap
apiVersion: v1
metadata:
  name: nginx-config
  namespace: nginx-ingress
data:
  opentracing: "True"
  opentracing-tracer: "/usr/local/lib/libjaegertracing_plugin.so"
  opentracing-tracer-config: |
    {
      "service_name": "nginx-ingress",
      "sampler": {
        "type": "const",
        "param": 1
      },
      "reporter": {
        "localAgentHostPort": "jaeger-agent.default.svc.cluster.local:6831"
      }
    }
To apply the config simply run:
$ kubectl apply –f nginx-config.yamlDeploying the Sample Applications
For simplicity, we’re using NGINX instances as our backend applications. We have two different applications, with App1 configured to redirect all HTTP traffic to App2.
Both applications make use of ConfigMaps and volumes to configure the NGINX instances running inside the pods. One of the ConfigMaps has the NGINX configuration. The other is used to specify the tracer configuration for each NGINX instance (we include the configuration in each app, because as previously mentioned the app pods need to have access to the tracer to send information about the requests).
Deploying App1
Here’s the YAML manifest for the first application (app1.yaml):
apiVersion: v1
kind: ConfigMap
metadata:
  name: app1-config
data:
  nginx.conf: |-
    user nginx;
    worker_processes  1;
    load_module modules/ngx_http_opentracing_module.so;
    error_log  /var/log/nginx/error.log warn;
    pid        /var/run/nginx.pid;
    events {
        worker_connections  1024;
    }
    http {
        opentracing_load_tracer /usr/local/lib/libjaegertracing_plugin.so
                                /etc/jaeger-config.json;
        opentracing on;
        server {
            listen 80;
            server_name example.com;
            location / {
                opentracing_propagate_context;
                proxy_set_header Host $host;
                proxy_pass http://app2-svc:80;
            }
        }
    }
---
apiVersion: v1
kind: ConfigMap
metadata:
  name: jaeger-config-app1
data:
  jaeger-config.json: |-
    {
      "service_name": "app1",
      "sampler": {
        "type": "const",
        "param": 1
      },
      "reporter": {
        "localAgentHostPort": "jaeger-agent.default.svc.cluster.local:6831"
      }
    }
---
apiVersion: apps/v1
kind: Deployment
metadata:
  name: app1
spec:
  replicas: 1
  selector:
    matchLabels:
      app: app1
  template:
    metadata:
      labels:
        app: app1
    spec:
      containers:
      - name: app1
        image: opentracing/nginx-opentracing
        ports:
        - containerPort: 80
        volumeMounts:
          - name: config-app1
            mountPath: /etc/nginx/nginx.conf
            subPath: nginx.conf
            readOnly: true
          - name: config-jaeger
            mountPath: /etc/jaeger-config.json
            subPath: jaeger-config.json
            readOnly: true
      volumes:
      - name: config-app1
        configMap:
          name: app1-config
      - name: config-jaeger
        configMap:
          name: jaeger-config-app1
---
apiVersion: v1
kind: Service
metadata:
  name: app1-svc
spec:
  ports:
  - port: 80
    targetPort: 80
  selector:
    app: app1
To deploy the first application, run this command:
$ kubectl apply –f app1.yamlDeploying App2
Here’s the YAML manifest for the second application (app2.yaml):
apiVersion: v1
kind: ConfigMap
metadata:
  name: app2-config
data:
  nginx.conf: |-
    user nginx;
    worker_processes  1;
    load_module modules/ngx_http_opentracing_module.so;
    error_log  /var/log/nginx/error.log warn;
    pid        /var/run/nginx.pid;
    events {
        worker_connections  1024;
    }
    http {
        opentracing_load_tracer /usr/local/lib/libjaegertracing_plugin.so
                                /etc/jaeger-config.json;
        opentracing on;
        server {
            listen 80;
            server_name example.com;
            location / {
                opentracing_propagate_context;
                opentracing_tag app app2;
                return 200 "Success!\n";
            }
        }
    }
---
apiVersion: v1
kind: ConfigMap
metadata:
  name: jaeger-config-app2
data:
  jaeger-config.json: |-
    {
      "service_name": "app2",
      "sampler": {
          "type": "const",
          "param": 1
      },
      "reporter": {
          "localAgentHostPort": "jaeger-agent.default.svc.cluster.local:6831"
      }
    }
---
apiVersion: apps/v1
kind: Deployment
metadata:
  name: app2
spec:
  replicas: 1
  selector:
    matchLabels:
      app: app2
  template:
    metadata:
      labels:
        app: app2
    spec:
      containers:
      - name: app2
        image: opentracing/nginx-opentracing
        ports:
        - containerPort: 80
        volumeMounts:
          - name: config-app2
            mountPath: /etc/nginx/nginx.conf
            subPath: nginx.conf
            readOnly: true
          - name: config-jaeger
            mountPath: /etc/jaeger-config.json
            subPath: jaeger-config.json
            readOnly: true
      volumes:
      - name: config-app2
        configMap:
          name: app2-config
      - name: config-jaeger
        configMap:
          name: jaeger-config-app2
---
apiVersion: v1
kind: Service
metadata:
  name: app2-svc
spec:
  ports:
  - port: 80
    targetPort: 80
  selector:
    app: app2
To deploy the second application, run this command:
$ kubectl apply -f app2.yamlDeploying the Ingress Resource
To enable access to App1 from outside the cluster, we create the following Ingress resource (opentracing-ingress.yaml):
apiVersion: extensions/v1beta1
kind: Ingress
metadata:
  name: opentracing-ingress
  annotations:
    nginx.org/location-snippets: |
      opentracing_propagate_context;
spec:
  rules:
  - host: example.com
    http:
      paths:
      - path: /
        backend:
          serviceName: app1-svc
          servicePort: 80
Note how we have used the nginx.org/location-snippets annotation to enable tracing context propagation at the Ingress Controller level. Snippet annotations are a way to add custom code to the final NGINX configuration in the Ingress Controller.
Finally, we apply the Ingress resource by running this command:
$ kubectl apply -f opentracing-ingress.yamlWe verify that both App1 and App2 are running:
$ kubectl get pods
NAME                      READY   STATUS    RESTARTS   AGE
app1-68fd9db45c-szqpr     1/1     Running   0          53m
app2-67c7788789-lvbgw     1/1     Running   0          53m
Tracing a Request
Now, we simply make a request to App1 through the Ingress Controller, where
$ curl --resolve example.com:IC_HTTP_PORT:IC_IP_ADDRESS http://example.com:IC_HTTP_PORT/ --insecure
Success!
Reviewing the Trace
We run the following command to enable access to the Jaeger UI, where JAEGER_POD is the “type/name” value for the pod we created from the all-in-one template in Deploying the Jaeger Tracer:
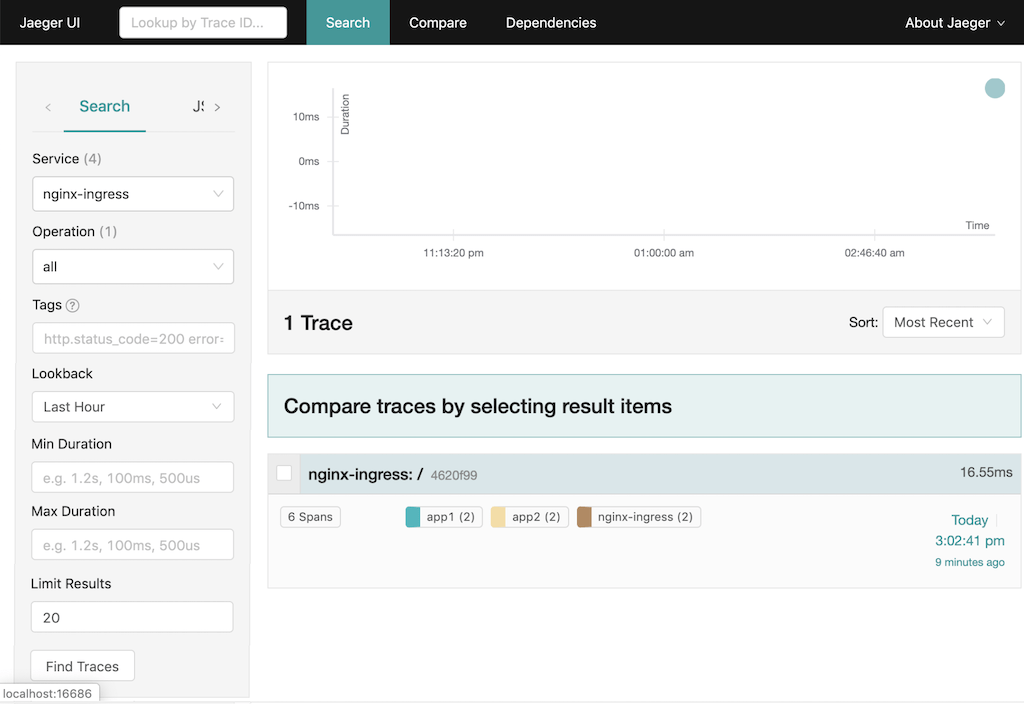
$ kubectl port-forward JAEGER_POD 16686:16686Every request creates a new trace. To view the trace for the request we just made, we open the Jaeger UI at http://localhost:16686 in our browser, type nginx-egress in the Service field in the left column, and click the Find Traces button at the bottom of the column.
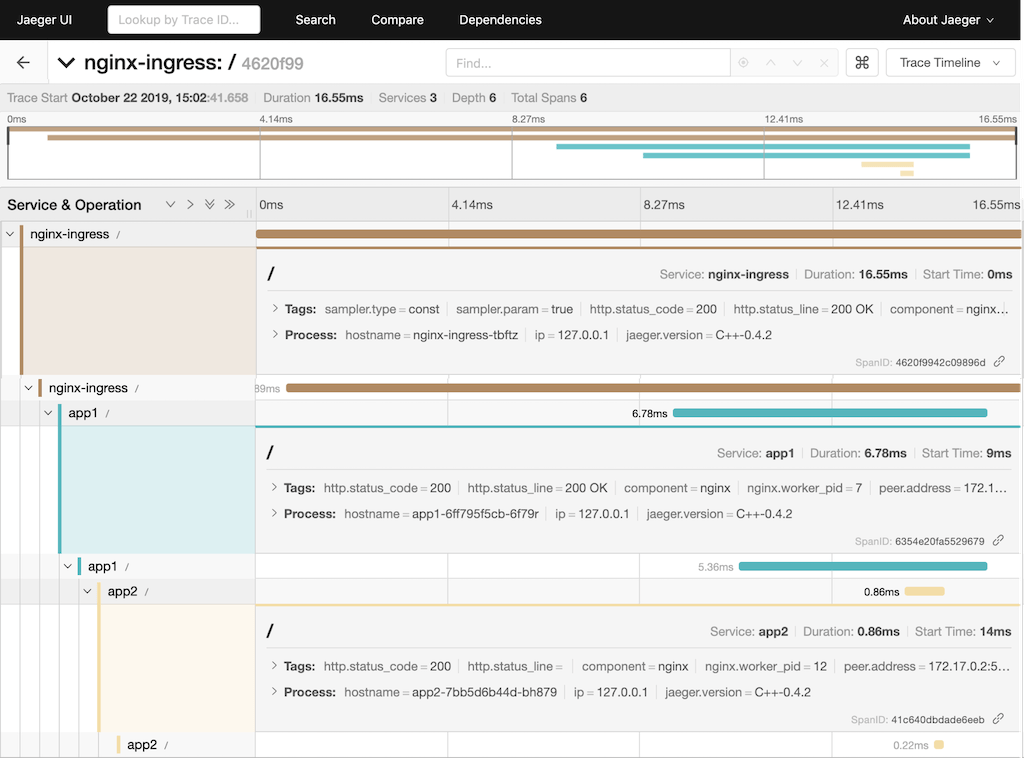
Click nginx-ingress in the right column of the search window to select the trace. In the window that opens (below), we see the three spans for our request: the brown represents the Ingress controller, the blue is App1, and the yellow is App2.

Click on a span to display more details about it, including the HTTP status code, hostname, IP address and Jaeger version.
Conclusion
Enabling OpenTracing for your services in Kubernetes helps you and your team understand what is happening in your applications and debug problems more quickly.
Additionally, being able to trace requests starting at the Ingress Controller pod gives you complete insight into requests sent from outside the cluster as they pass through every service.
Discover how the enhanced features in NGINX Plus can boost your Kubernetes deployment – start your free 30-day trial today or contact us to discuss your use cases.