We are pleased to announce that NGINX Plus Release 19 (R19) is now available. NGINX Plus is the only all-in-one load balancer, content cache, web server, and API gateway. Based on NGINX Open Source, NGINX Plus includes exclusive enhanced features and award‑winning support. A primary focus of the release is monitoring, with new capabilities that make it more granular and flexible, for enhanced reliability of your applications at scale.
New features in NGINX Plus R19 include:
- More flexible monitoring – We’ve added new capabilities for finer‑grained insight and easier analysis of your NGINX Plus ecosystem, including optional separate metrics collection for
locationblocks, new metrics about DNS lookup activity, and support for export in Prometheus format as well as JSON. The NGINX Plus dashboard displays the new per‑location metrics and has new tabs for the DNS metrics and metrics about NGINX Plus clusters. - Dry‑run mode for testing rate limits – Setting the correct rate limits for production traffic is hard and very risky – get it wrong and you could seriously impact the user experience of a large proportion of your users. With the new dry‑run mode you can understand the effect of your rate limits on production traffic without actually applying them.
- Enhancements to the key‑value store – You can now store IP address ranges in the key‑value store along with individual addresses, and set expiration times on individual entries.
- Dynamic bandwidth control – When configuring bandwidth limits, you can now set the rate as a variable, enabling you to apply different limits based on any attribute of the incoming traffic.
Important Changes in Behavior
-
Obsolete APIs – NGINX Plus R13 (released in August 2017) introduced the all‑new NGINX Plus API for metrics collection and dynamic reconfiguration of upstream groups, replacing the Status and Upstream Conf APIs that previously implemented those functions. As announced at the time, the deprecated APIs continued to be available and supported for a significant period of time, which ended with NGINX Plus R16. If your configuration includes the
statusand/orupstream_confdirectives, you must replace them with theapidirective as part of the upgrade to R19.For advice and assistance in migrating to the new NGINX Plus API, please see the transition guide on our blog, or contact our support team.
-
New operating systems supported –
- Alpine 3.10
- Debian 10 (“Buster”)
- Ubuntu 19.04 (“Disco”)
-
Older operating systems no longer supported –
- Debian 8 (“Jessie”)
- Ubuntu 14.04 (“Trusty”)
- Ubuntu 18.10 (“Cosmic”)
For more information about supported platforms, see the technical specifications for NGINX Plus and dynamic modules.
New Features in Detail
New Features Make Monitoring Even More Flexible
NGINX Plus R19 makes monitoring even more flexible, extending both the kinds of metrics you can collect and the ways you can analyze them.
Per-Location Metrics
The NGINX Plus API provides a wide range of real‑time monitoring metrics, including several counters about a virtual server when you include the status_zone directive in its server{} block. With NGINX Plus R19 you can now collect metrics for individual location blocks in addition to (or instead of) the parent server{} block, by adding the status_zone directive to those location blocks. This finer‑grained monitoring enables you to detect more quickly the exact parts of your website that are generating errors, for more effective troubleshooting.
The following configuration enables metrics collection for an entire website, and in addition for all requests to URIs that start with /admin/.
You can then access the metrics at the http/location_zones endpoint.
$ curl http://localhost:8080/api/5/http/location_zones
{
  "www_admin": {
    "requests": 3393,
    "responses": {
      "1xx": 0,
      "2xx": 3307,
      "3xx": 81,
      "4xx": 5,
      "5xx": 0,
      "total": 3393
    },
    "discarded": 0,
    "received": 15403,
    "sent": 835227
  }
}
It is also possible to place the status_zone directive within an if block, but note that metrics are only counted once for a given location, and from the last status_zone directive that was encountered during request processing. The following configuration extends the previous example by collecting separate metrics whenever a request to the /admin/ location includes a query string.
DNS Resolver Metrics
The NGINX Plus API has also been extended with metrics for tracking DNS lookup activity, in particular about DNS request types and response statuses. To collect metrics about a group of DNS servers that NGINX Plus queries for name lookups, add the status_zone parameter to the resolver directive.
You can then access the metrics at the resolvers endpoint.
$ curl http://localhost:8080/api/5/resolvers
{
"internal_dns": {
"requests": {
"name": 132,
"srv": 0,
"addr": 0
},
"responses": {
"noerror": 130,
"formerr": 0,
"servfail": 0,
"nxdomain": 0,
"notimp": 0,
"refused": 0,
"timedout": 2,
"unknown": 0
}
}
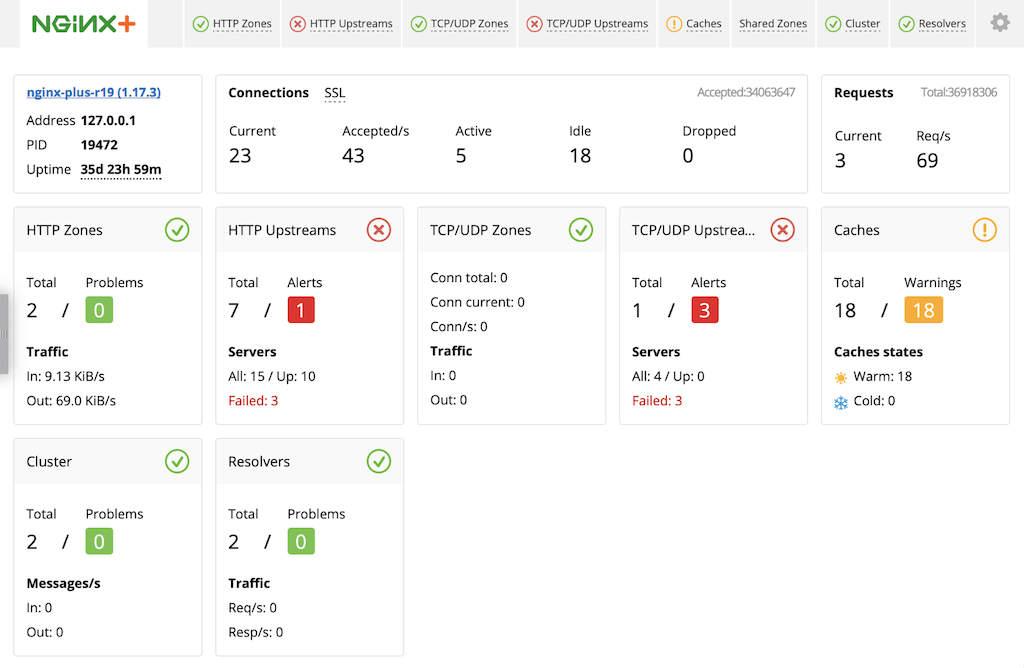
}Updates to the Live Activity Monitoring Dashboard
The NGINX Plus live activity monitoring dashboard provides a convenient centralized location for tracking metrics collected by the NGINX Plus API. The dashboard has been extended in NGINX Plus R19 to include the new resolver and per‑location metrics discussed above. In addition, it now reports metrics relating to runtime state sharing in a cluster (as enabled with the Zone Synchronization module), which were previously accessible only through the NGINX Plus API.
There are two renamed tabs and two new tabs:
- HTTP Zones is the new name for the Server zones tab. The tab now displays metrics about
locationblocks as well asserverblocks. - HTTP Upstreams is the new name for the Upstreams tab. This provides clarity when both HTTP and TCP/UDP modules are configured.
- The new Cluster tab displays metrics about state sharing in NGINX Plus clusters.
- The new Resolvers tab displays metrics about DNS lookup activity.
To explore the new dashboard, visit https://demo.nginx.com/.
New Module for Prometheus Monitoring
The NGINX Plus API returns metrics in JSON format, which is a common and convenient format for integration with external monitoring and application performance management (APM) solutions. You can now also export metrics in Prometheus format, which is particularly popular in Kubernetes environments.
The Prometheus-njs module exposes the Prometheus metrics. To enable the exported metrics:
- Install the Prometheus-njs module.
- Configure the NGINX Plus API.
-
Configure a dedicated location for Prometheus metrics collection in the NGINX Plus configuration file.
- Configure Prometheus to obtain metrics from NGINX Plus by specifying the network address of the NGINX Plus instance in a
scrape_configsection in the Prometheus configuration file.
Testing Rate Limits in Dry-Run Mode
NGINX Plus provides a very flexible approach to rate limiting. Multiple rate limits can be tracked and enforced at once. Enforcement itself comes in five different flavors – including delaying excessive requests, rejecting them outright, and permitting a burst of unrestricted requests before enforcement – plus combinations of those behaviors. For a detailed explanation, see our blog.
While this flexibility can make for highly refined rate limiting, how do you determine the appropriate rate limit for your traffic in the first place? How can you tell ahead of time whether your planned rate limit is too high (in which case your servers can be overwhelmed) or too low (in which case the user experience might be impacted)?
The best source of information is the NGINX Plus error log, where a detailed entry like the following is created when NGINX Plus delays or rejects a request:
2019/09/03 11:42:12 [error] 57#57: *339 limiting requests, excess: 0.600 by zone "my_limit", client: 172.17.0.1, server: www.example.com, request: "GET / HTTP/1.1", host: "www.example.com:80"The entry tells you useful things like how many requests per millisecond over the configured rate this request represents (the excess field), the particular limit that was exceeded (the zone field) and the client’s IP address (the client field). But the information is still useful for planning purposes only if you can get it before you actually enforce the limits on your traffic.
NGINX Plus R19 adds this predictive capability with a “dry‑run” mode for rate limiting. Log entries are created as normal but the rate limits are not enforced. To enable dry‑run mode, include the new limit_req_dry_run directive in the same block as the limit_req directive or directives.
In the following example, the limit_req_zone directives define four different rate limits, from 10,000 requests per second down to 10 requests per second. We apply those rates with the limit_req directives in the root location block (lines 9–12), along with the limit_req_dry_run directive to disable enforcement.
NGINX Plus writes a log entry, marked clearly with dry run, for every request that would exceed a given rate limit. In our analysis of the log we can then filter the entries by the zone field to determine which of the rate limits gives us the desired behavior.
2019/09/03 11:56:26 [error] 142#142: *22282 limiting requests, dry run, excess: 1.000 by zone "1000rs", client: 172.17.0.1, server: www.example.com, request: "GET / HTTP/1.1", host: "www.example.com:80"Enhancements to the Key-Value Store
With the in‑memory key‑value store for NGINX Plus, you can use the NGINX Plus API to dynamically configure traffic management based on attributes of the request. Sample use cases include dynamic blacklisting of IP addresses, dynamic bandwidth limiting, and caching of authentication tokens.
Support for Network Ranges
NGINX Plus R19 extends the key‑value store by adding support for IP network ranges (subnets) to the existing support for individual IP addresses. This means a single entry in the key‑value store can match all of the IP addresses in a network range, simplifying configuration and saving you time because you don’t have to individually add the addresses that make up a range. The key‑value store uses CIDR notation to represent network ranges. For example, 192.168.13.0/24 represents the addresses 192.168.13.0 through 192.168.13.255. Both IPv4 and IPv6 addresses and ranges are supported.
To enable network ranges, include the new type=ip parameter to the keyval_zone directive, as in the following configuration for dynamic blacklisting of IP addresses. When NGINX Plus performs a lookup, any IP address within a network range stored in the key‑value store returns a match.
Line 2 specifies that the $in_blacklist variable is evaluated by performing a lookup in the blacklist key‑value store, using $remote_addr (the client IP address) as the key. The simple if block (lines 8–10) then rejects a request when the client IP address is in the blacklist.
The following curl command invokes the NGINX Plus API to create an entry in the key‑value store for the network range mentioned above.
$ curl -X POST -d '{"192.168.13.0/24":"1"}' http://localhost:8080/api/5/http/keyvals/blacklistPer-Entry Expiration Timeouts
In the previous section, the timeout=24h parameter to the keyval_zone directive on line 1 of blacklist.conf means that each entry in the blacklist key‑value store expires (and is removed from the store) 24 hours after it is created.
With NGINX Plus R19, you can override the default timeout (set for the entire key‑value store by the timeout parameter) with a different timeout for any individual entry. Individual timeouts can be larger or smaller than the default.
To create an entry with a non‑default timeout, provide the value as a JSON object with two fields:
value– Set to the desired value, in this case1to populate the$in_blacklistvariableexpire– Set to the number of milliseconds after creation the value expires
The following JSON represents a blacklist entry for localhost (127.0.0.1) that expires in 1 hour (3,600,000 milliseconds).
{
  "127.0.0.1": {
    "value": "1",
    "expire": 3600000
  }
}
The following curl command creates that entry in the key‑value store:
$ curl -X POST -d '{"127.0.0.1":{"value":"1","expire":3600000}}' http://localhost:8080/api/5/http/keyvals/blacklistDynamic Bandwidth Control
The limit_rate directive sets the rate (number of bytes per second) at which NGINX Plus sends the response to an HTTP request, and the limit_rate_after directive sets the number of bytes NGINX Plus sends before that limit is applied. With NGINX Plus R19, the parameter to each directive can be a variable rather than a static value, enabling dynamic control of bandwidth usage based on attributes of the request.
The following example configuration sets the bandwidth according to the version of TLS used by the client, effectively rewarding more modern browsers with faster responses.
In previous NGINX Plus releases, you could limit bandwidth by setting the $limit_rate variable; we recommend that you use this more streamlined method instead. For details, see the documentation for the limit_rate directive.
The proxy_download_rate and proxy_upload_rate directives for TCP/UDP traffic now also accept a variable parameter.
For even more sophisticated bandwidth limiting, you can use scripting extensions such as the NGINX JavaScript module (njs) to implement advanced, custom logic for determining the appropriate bandwidth limit for a given connection.
Updates to the NGINX Plus Ecosystem
JavaScript Module enhancements
The NGINX JavaScript module (njs) has been updated to version 0.3.5. The most notable enhancements (cumulative from previous versions) are:
- Support for arrow functions (thanks to 洪志道 [Hong Zhi Dao] and Artem S. Povalyukhin)
- A global
processobject (especially useful for reading environment variables) String.prototype.trimfunctions
Upgrade or Try NGINX Plus
If you’re running NGINX Plus, we strongly encourage you to upgrade to NGINX Plus R19 as soon as possible. You’ll also pick up a number of additional fixes and improvements, and it will help NGINX to help you when you need to raise a support ticket.
Please carefully review the new features and changes in behavior described in this blog post before proceeding with the upgrade.
If you haven’t tried NGINX Plus, we encourage you to try it out – for security, load balancing, and API gateway, or as a fully supported web server with enhanced monitoring and management APIs. You can get started today with a free 30‑day evaluation. See for yourself how NGINX Plus can help you deliver and scale your applications.